


When trying to discern which players are good at passing, it feels natural to look at their passing accuracy. After all, if you’re good at passing, you should complete a high percentage of your passes, right?. And if you’re not so good at passing, you would assume that it would be reflected in a low pass accuracy. But just like all stats, passing accuracy lacks context. And without that context it can be very misleading.
The thing with passing accuracy is that it is very basic, it cares only about passes attempted and passes completed – it couldn’t care any less (because it doesn’t care at all…) about the nature of those passes.
And if any of you are thinking about what the implications of its basic nature are, you might be thinking, ‘so you could have a very high passing accuracy by only attempting very easy passes?’ And if you were thinking that, you’d be spot on. Conversely, there will be very skilled passers who, as a result, attempt very difficult passes and thus fail to complete many of them, leading to them having a low passing accuracy whilst truly being a good passer.
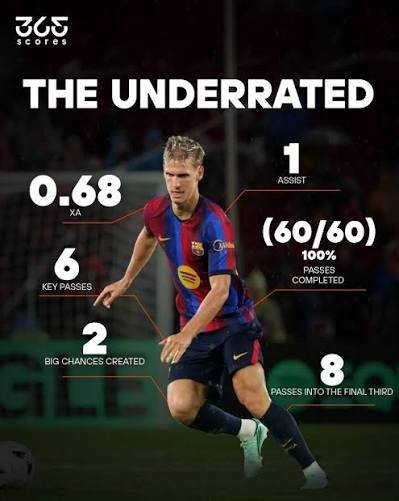
The game that lit the light bulb up in my mind for this idea was Dani Olmo’s performance against Racing Santander earlier this season. In that game, Olmo completed 60/60 passes and with that being the first time I’d ever seen a player flawlessly complete such a high volume of passes, I wanted to know if he got away with a plethora of sideways and backwards passes or if he really had one of the most impressive performances of his career.
Why do we use passing accuracy?
Passing accuracy acts as the most simple and direct representation of how successfully a player passed the ball in a game. It simply tells us what percentage of passes the player completed. But its simplicity is also why it is such a widely used and understood metric – it’s the kind of statistic that every football fan can make sense of and form conclusions from. Intuitively, players who are good at passing will complete a higher percentage of their passes – passing accuracy therefore, gives us a rough insight into who the best passers are in world football.
The flaws of passing accuracy
But as I just mentioned, passing accuracy gives us a rough insight into who the best passers are. It doesn’t have any context behind the nature of passes it tracks. Obviously, passes in football are unique and along with that uniqueness, they each have varying levels of difficulty. A 5-yard pass under no pressure going backwards is much easier than a pressured, driven pass that aims to bypass two lines of defense. Were we to use passing accuracy in isolation and determine, based on that alone, who the best passers in the world were, we would be inadvertently assuming that all passes are the exact same – and they are not. So, the problem with passing accuracy is that it doesn’t tell us anything about the passes that it tracks, just whether or not those passes were completed.
But maybe the problem has nothing to do with passing accuracy itself, and everything to do with how we respond to it – after all, there is nothing compelling us to take pieces of data as gospel.
If a midfielder completes just 70% of their passes, the intuitive idea is that they aren’t very good at passing since that is a relatively low percentage (the average for midfielders in Europe’s top 5 leagues last season was 85.59%). And if one completes 90% of their passes, that is flagged as one of their most impressive stats. And since intuition is much more powerful than we would like to admit, we are often susceptible to taking stats like passing accuracy at face value.
This means that we could miss the fact that the game in which a player completed 70% of their passes, they also created 5 big chances. And for the one who completed 90%, they did nothing more than harmlessly circulate the ball.
Expected Threat and passing accuracy
This is where Expected Threat (xThreat/xT) can help.
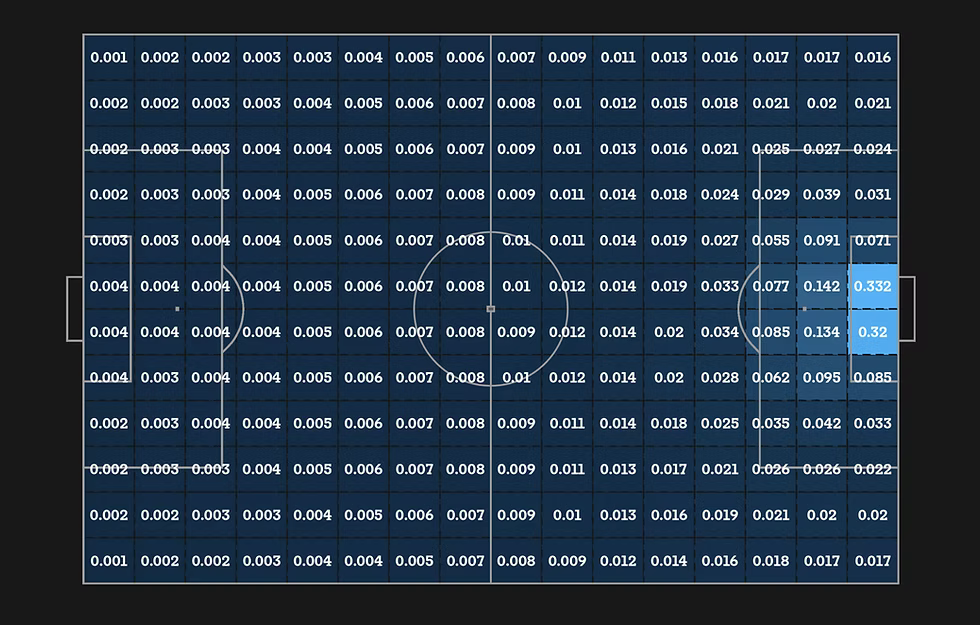
xT breaks the pitch up into zones, each having its own ‘threat value’. And the values are determined by how likely a goal is to be scored after the ball reaches that zone. So, not the likelihood that a goal comes directly from the zone, but how likely a goal will be scored now that the ball is in said zone.
The zones close to your own goal have a low threat value since the ball being there poses little threat to the opposition and many non-goal scoring sequences come after the ball resides in these zones. Conversely, those close to the opposition goal have a higher threat value since the ball being there poses a greater threat to the opposition.
xThreat looks to quantify how impactful passes and carries are by looking at where they began and then where they finished on the pitch. In this case, we were only interested in passes of course, so carries will be disregarded in any mention of xT going forward.
This means that if you pass from a dangerous position to a less dangerous one (i.e. a backwards pass to keep possession), xT will pick that up and the pass will receive a negative xT value. And similarly if you pass from a lower threat to higher threat area, that pass will receive a positive xT rating.
Now it would be reasonable to anticipate that passes with positive xT ratings will be the more difficult passes to complete since defenses will actively be trying to defend those threatening zones. And on the flip side, sideways and backwards passes that pose little to no threat to the opposition will be the easiest to complete as the defending team has less incentive to actively defend those kinds of passes.
This means that the intuitive thought I mentioned in the introduction regarding a player who has a high pass accuracy by attempting a bundle of easy passes can be captured by xT. This is clearly very useful in conjunction with passing accuracy because it can provide some of the context behind the nature of passes that it otherwise lacks.
xT and xT per pass
There is a distinction between xT and xT per pass, and both can be useful for what this essay looks to make clear. xT is a counting stat so rewards players who play more passes, hence why some of the highest xT games from last season are from Bruno Fernandes. He’s the focal point and chief creator at Manchester United which means he sees a lot of the ball, plays more passes, and naturally accumulates higher xT.
xT per pass is normalised for the number of passes played so rewards players who might be less involved overall, but play more dangerous passes on average. Therefore, there is a stronger correlation between passing accuracy and xT per Pass than just xT. This makes sense because if someone plays 200 relatively safe forward passes, they will likely have accumulated a lot of xT just because of the sheer volume of passes they complete. But if someone has higher xT per pass, they are most likely playing riskier passes on average and will complete less as a result.
Expected Threat and Passing Accuracy
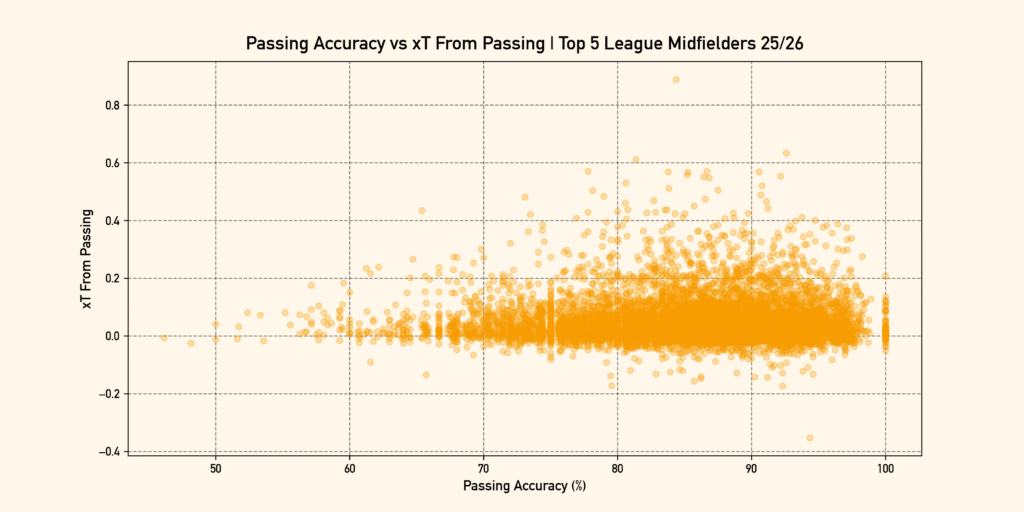
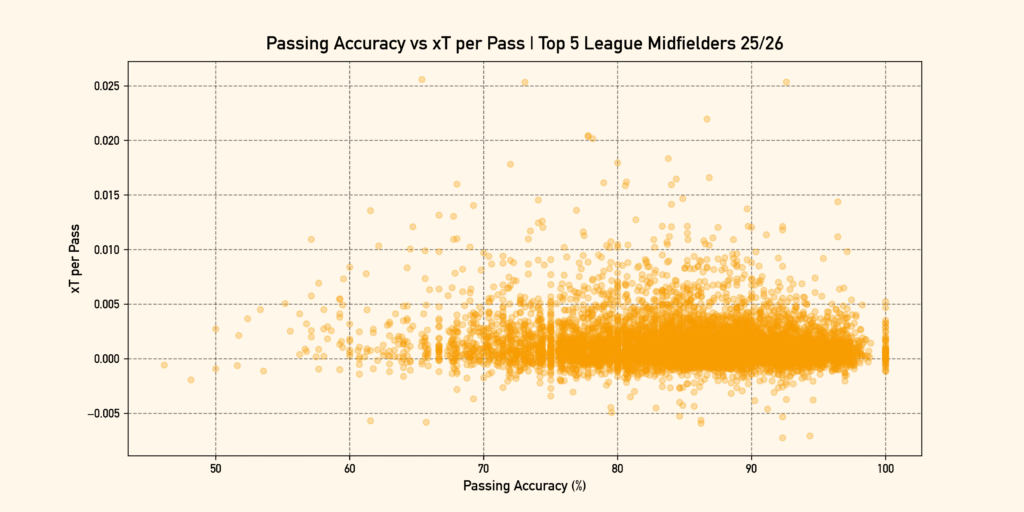
We had a look at every game from midfielders who completed at least 25 passes in Europe’s top 5 leagues last season and cross referenced their passing accuracy with their xT. And these were the key stats we found from the group:
| — | Passing Accuracy | xT | xT per pass | Passes Completed | Passes Attempted |
|---|---|---|---|---|---|
| Mean | 85.59% | 0.0559 | 0.0014 | 39.72 | 46.41 |
| Median | 83.72% | 0.0300 | 0.0008 | 36.00 | 43.00 |
So, we found that there wasn’t a massive relationship between xT and passing accuracy – which suggests that it isn’t always true that the safer your passes are, the more likely you are to complete them. This could be explained by the fact that incomplete passes give a player no xT; thus making the completion of passes a more reliable way to accumulate xT rather than attempting difficult passes.
Interestingly, the highest xT from any player in a game was Bruno Fernandes’ performance against Newcastle last season. He accumulated a massive 0.889 xT on 54/64 passes (84.4%). Contrast that with the fact that of the 53 instances in which a midfielder completed 100% of their passes, none had an xT of higher than 0.208, and you see that high accuracy may be a reliable way to accumulate xT, but it is not the most effective.
But as I stated, there was a stronger correlation between xT per pass and passing accuracy (-0.201). This suggests that the riskier your passes are on average, the fewer passes you will complete – which again supports the intuitive idea surrounding risky and safe passes as they pertain to passing accuracy.
Patrizio Masini (against Roma last season) had the highest xT per pass at 0.026. In that game he only completed 17/26 passes (65.4% accuracy) and still managed to accumulate 0.435 xT overall. The highest xT per pass for those players who completed 100% of their passes was just 0.005.
The Limitations of xThreat
So, there is an important caveat to mention with xThreat. Yes, it adds some much needed context around passes, but it also has limitations that are worth mentioning. The very nature of ‘expected’ stats make it so that they are just a prediction based on historical events of that kind. For xThreat, the ‘threat rating’ of the zones is just a prediction of how much more likely you are to score by moving the ball into that specific zone. For example, it says nothing about how many defenders are between the ball and the goal when it gets there, just that getting it there has an impact on the probability that a team will score on that possession.
This inability to capture surrounding influences that may impact a player’s ability to complete a pass such as defenders close to them or the intended target, pace of play, the type of pass played, game state, and other contextual cues mean that xThreat is not a perfect metric when assessing one’s ability to pass. It could be the case that a player has a low xThreat not because they cannot complete difficult passes, but because the opportunities to play them didn’t arise.
In this essay, however, xThreat does a good job of illustrating the flaws of passing accuracy, and our reactions to it. It can ascertain, to a reasonable degree, if one’s passing accuracy is high because they attempt typically easy passes or because they are good at passing. And in the same light, it can identify that a player who had a low passing accuracy actually had a massively positive impact on the game by routinely playing typically difficult passes into threatening positions.
Now that’s out of the way, let’s look at some examples.
High accuracy, low xThreat
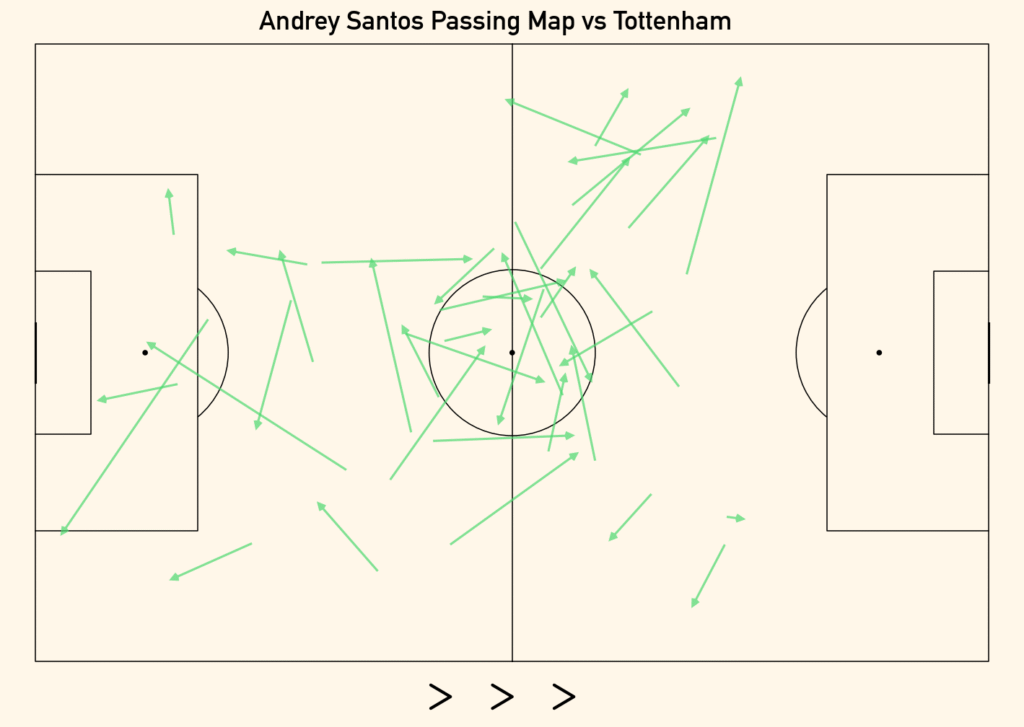
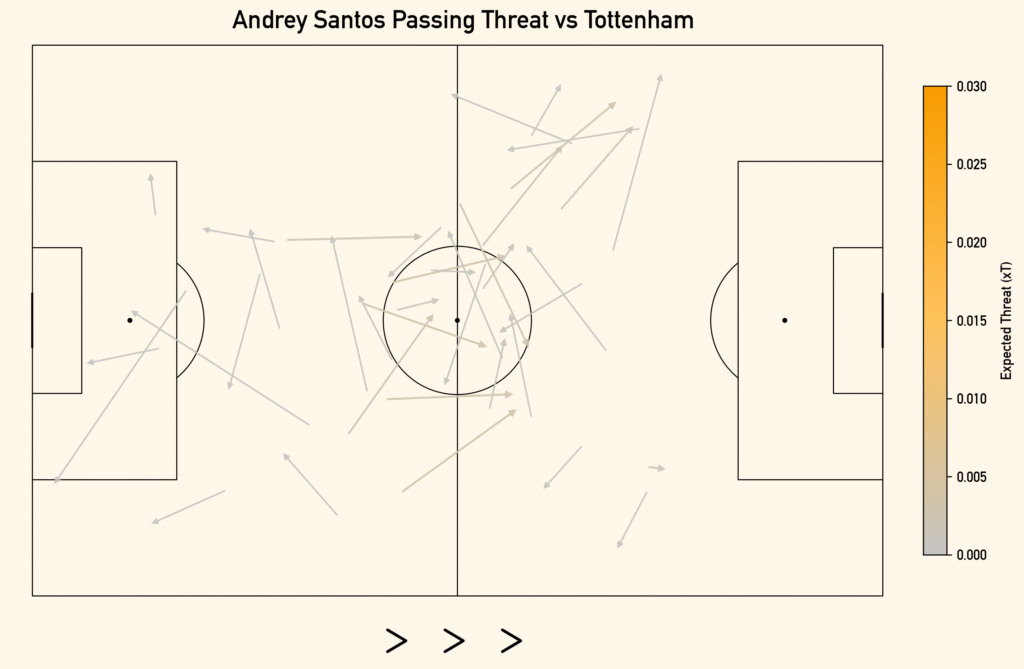
Here is where we can see an instance of that idea from the introduction – a player with a high passing accuracy, because the passes themselves were very easy. Andrey Santos completed 38/38 passes against Tottenham in a 2-1 win at Stamford Bridge in May of last season. When you consider that the mean passing accuracy for the set of players we looked at was 85.59%, this passing performance from Santos was especially impressive… or was it?
The passing map shows that the vast majority of those passes were sideways and backwards, relatively far from the opposition goal. And this makes sense as he spent the entire 90 minutes in a deep double pivot alongside Moises Caicedo. The nature of his passes can be seen in the passing threat map as he averaged a measly -0.0002 xT per pass, adding up to a total of -0.007 xT for the entire game.
Now as I said before, xT is limited in the fact that it only projects how threatening passes into specific zones will be, so theoretically one of these sideways passes could have been very difficult or even kickstarted a threatening attacking transition. So, I went back and watched every single one of his passes and found that in this case, we can take the maps at face value. None of Santos’ 38 passes in this game were particularly difficult. The vast majority of them were simple passes back to his defenders to continue the circulation of possession.
Now these passes are still valuable, as having ball circulators in holding midfield is essential, but none of the passes were exactly difficult for him to complete. And if I had access to a stat like xPass – which looks to determine the difficulty of passes by looking at factors like pressure, position, type of pass, and defenders, I would expect these passes to have a high expected completion rate. For a deeper dive into what xPass tries to do read this from Opta.
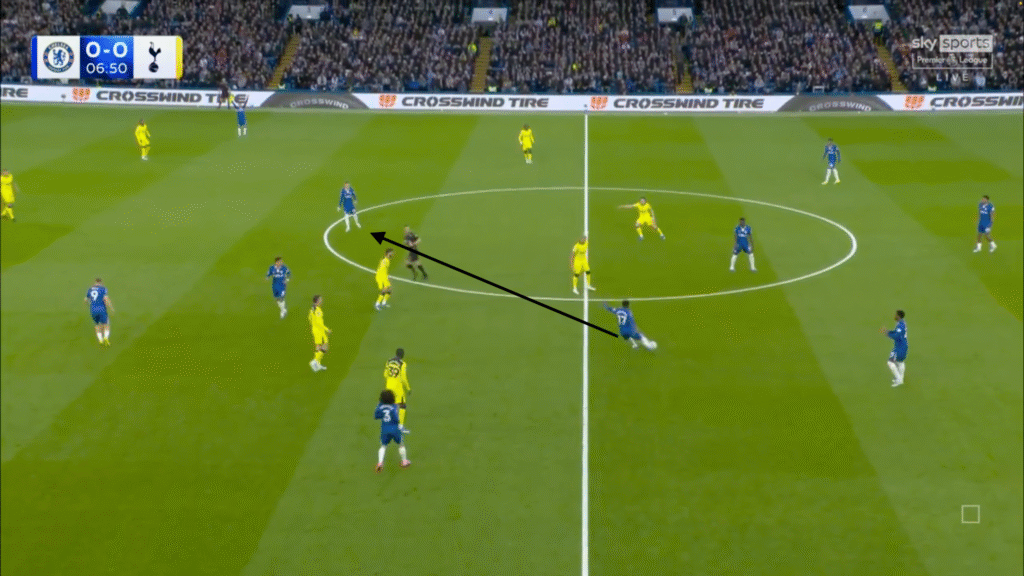
In fact, the only one that had to bypass multiple players was this one; and even then, the lane here was wide open.
So, this game would be an instance of a player having an extremely high passing accuracy, but not having to complete many (or any) difficult passes, or having a direct impact in helping their team score.
Low accuracy, high xThreat
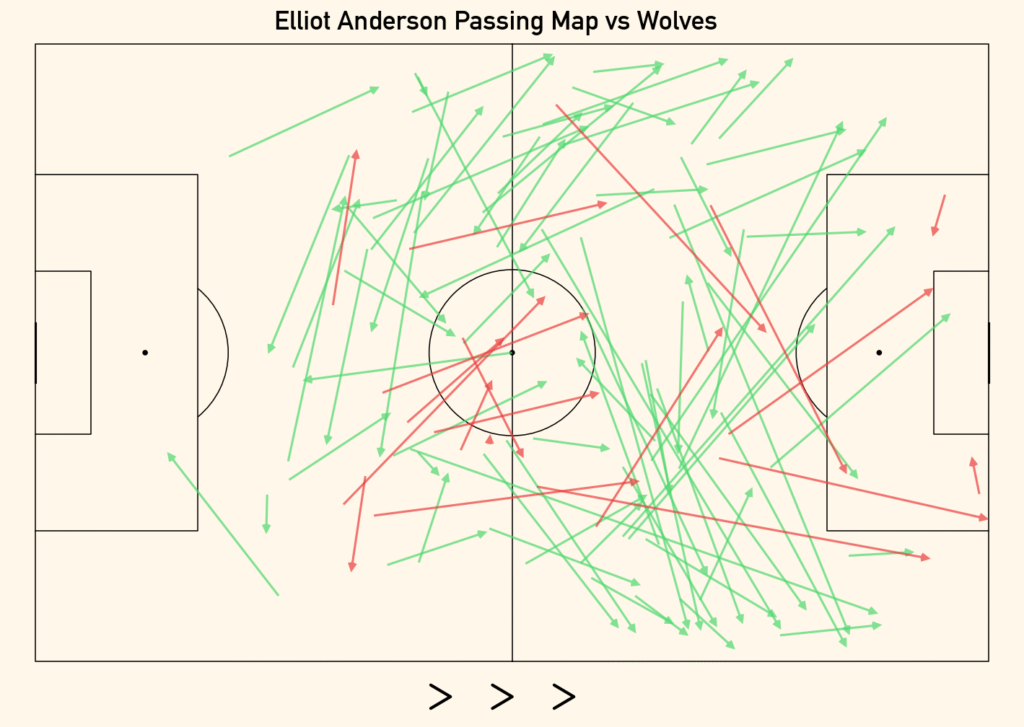
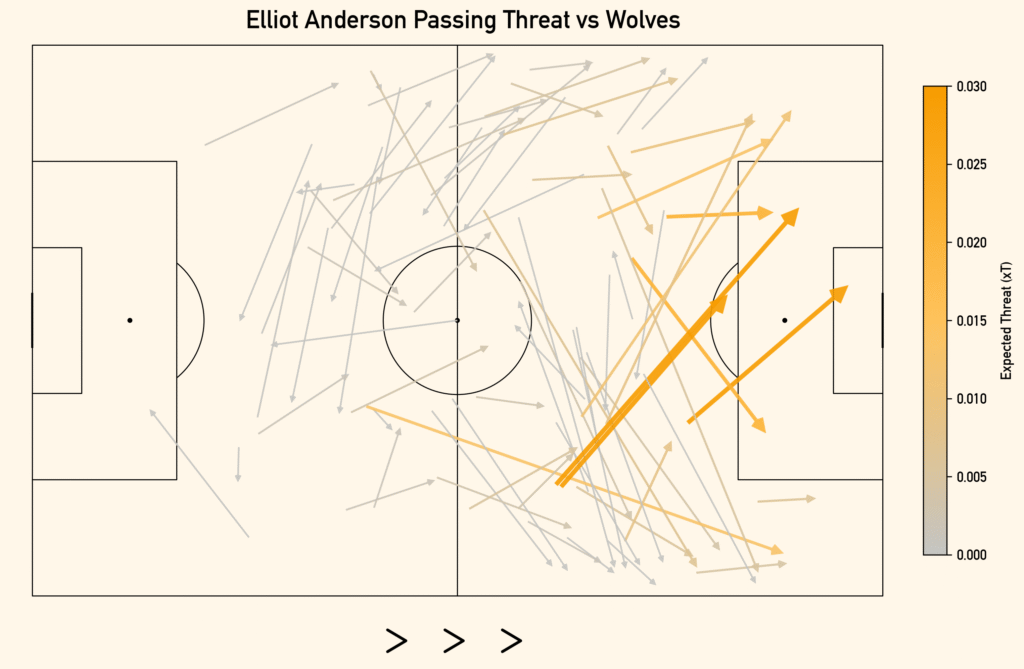
Elliot Anderson completed 79/98 passes (80.6% accuracy) against Wolves in February – almost 5 points lower than the average (85.59%) for midfielders last season. However, his total xT for that game was a whopping 0.530 – far higher than the average of 0.0559. And his xT per pass was 0.007, above the average of 0.0014.
What was most interesting about is game though was the number of incomplete passes that would have yielded high xT numbers. As his passing maps show, along with the numerous completed passes that ended up in threatening areas, he also had a plethora of incomplete passes that aimed to pose similar threat. This supports the idea that as you attempt more threatening passes, passing accuracy falls.
And whilst this is just one game, and does not rid xT of its flaws, it perfectly illustrates how passing accuracy can be misleading. One may contrast Andrey Santos’ game with Anderson’s and conclude that Santos was the more impressive due to the fact that he completed every pass and his accuracy sat so high above the average. But with the context that xT adds, it is clear that Anderson had a more profound impact on the game with his desire to advance play and create chances shining through his underlying stats.
And since Anderson’s total number of passes was so high, one could argue that had he been less involved in play, the stats wouldn’t support the idea that low accuracy closely relates to high xT.

So to cover that base, Bruno Fernandes against Liverpool in May last season completed 28/36 passes (77.8% accuracy) but accumulated 0.571 xT with those 28 completed passes. This meant that his xT per pass was .020 which is more than 14 times higher than the average of 0.0014. And when you consider what Bruno Fernandes is as a player, it is no surprise that, in our research, his performances were the ones that best supported the idea I’m presenting. He often plays high risk, high reward passes which manifest in a low passing accuracy, but a high xT.
Dani Olmo – The unicorn
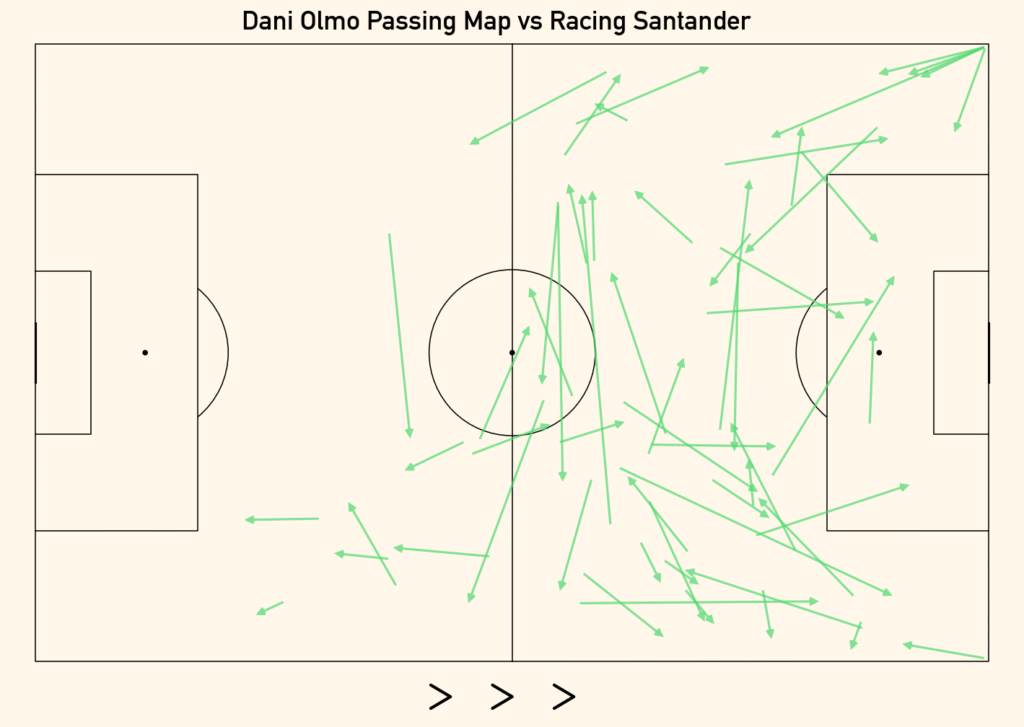
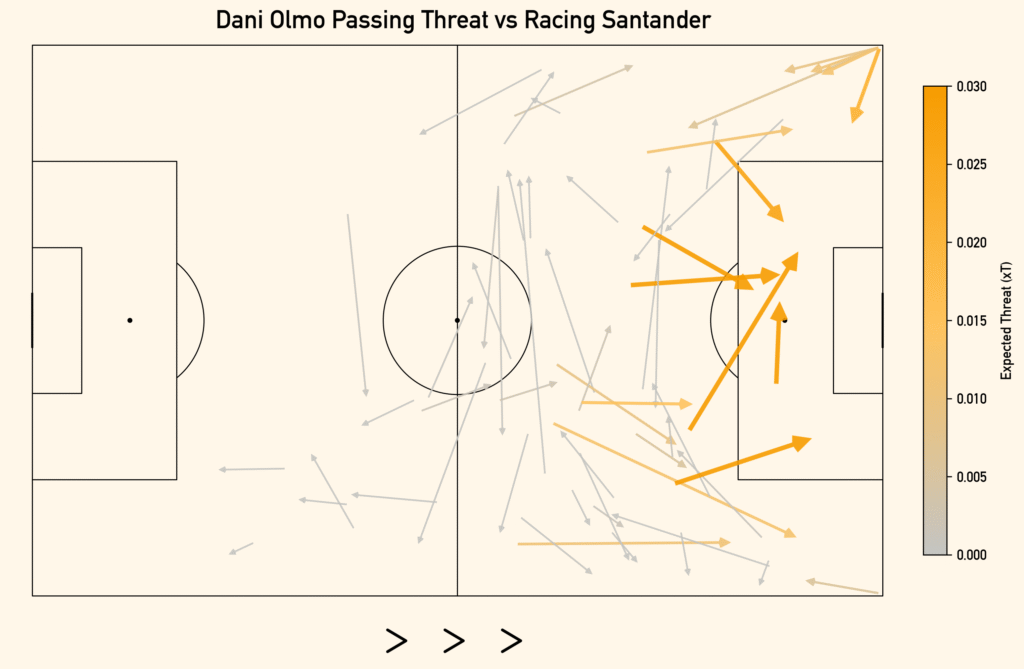
And then there was the game that inspired this entire investigation – Dani Olmo vs Racing Santander in September this season. It’s possible that I’m overstating this, but his passing performance in this game was perfect – both literally and figuratively. Of course, he completed 60/60 passes (100% accuracy), but he also accumulated 0.368 xT – giving him a stellar 0.0061 xT per pass.
The maps show that not only did he play the kinds of circulatory passes that Santos perfected against Tottenham, but he also mixed in a plethora of highly threatening passes (5 of which took Barcelona from outside of the box to inside it). This is a game that transcends the relationship between passing accuracy and xT. He sacrificed no efficiency and was still able to make a substantial impact on the game with his passing.
And maybe that the most valuable part of this investigation. It makes the games where players truly display pure excellence transcend the status quo. And when we spotlight players who we feel have outstanding games, excellence is what we are trying to point out. With what has been discussed here, the bar for what is truly excellent has been raised to a level that adequately fits that description.
Conclusion
Passing accuracy can be very useful. It can give us the most fundamental understanding of how well a player completes passes. But it doesn’t give us any insight into what kinds of passes they were, and how that can have a direct impact on the subsequent success rate.
With the use of xT, which itself is not perfect, we found that there is a correlation between players who regularly attempt more typically risky passes (high xT per pass) and a lower passing accuracy. So, the intuitive idea that a player might only have a high passing accuracy because they attempted safe passes was shown to have real merit – as we saw with the Andrey Santos example. And then games in which one may conclude aren’t all that impressive when looking at passing accuracy alone can end up being some of the most impactful and excellent performances. Elliot Anderson and Bruno Fernandes being the chief examples we covered.
On the whole, passing accuracy is very misleading. But then so are a whole plethora of stats. So, as I stated at the beginning, the problem may not be with the stat itself, but instead with how much stock we place in it.






Is Reece James being phased out of football?